How Big Data Is Changing the Financial Industry

How Big Data is changing the Financial Industry
Big Data is the talk of the town these days; not only has it ushered in the next generation of technology, but it has also modified the way businesses and financial institutions are performing their day to day activities.

Financial institutions are always on the lookout to enhance their day to day operations while keeping their competitiveness intact. Let’s have a quick look at analyzing the top 5 financial trends which are quickly taking over the financial industry and paving the path for modernizations.

Strengthening Financial Models: Data is prevalent in every industry. Financial institutions such as banks, lending institutions, trading firms, etc., produce tons of data on a regular basis. To manage such voluminous data, there is an imminent need to bring into operation a data handling language which is equipped to handle, manipulate and analyze massive volumes of information – this is where the role of Big Data comes into the picture. Financial institutions often work on different business and financial models, especially with respect to approving loans, trading stocks, etc. To make efficient working models past data trends need to be taken into consideration. The better the data relativity, the stronger the model and lesser would the risks involved. All such strategies can be derived from the use of Big Data, which in turn becomes an effective method to drive data-driven models through different financial services.

Enhanced Data Processing and Storage: Technology will never stop growing. Since the aforementioned has become an inseparable part of every organization’s life cycle, the data generated by daily operations gives way to the need of the hour storage and data processing. If one talks about the use of Big Data, the name is a clear giveaway in itself; it encompasses the use of the language, which means storing data in the Cloud or on other shared servers becomes a cinch. Thus distribution and processing come as a byproduct of storage capabilities. Cloud management, data storage, and data processing have become the words to reckon with, as more and more organizations are considering opportunities within the technical world.

Machine Learning Generates Better Returns: Financial Institutions deal with customer data on a day to day basis. Not only is such information critical, but very valuable, since it gives insights into the daily functioning of the bank. Considering the sensitivity of the data, there is a pressing need to evaluate the stored data, and protect it from fraudulent activities, while ensuring the risk is reduced drastically. Machine Learning has become an integral part of modern fraud prevention systems, which help to enhance risk management and prevent fraudsters from entering into protected domains.

Blockchain Technology: When customer data is at the fore, and financial transactions are at risk, Anti-Money Laundering (AML) practices become a topic of deliberation. Many people are beginning to give considerable importance to Blockchain technology within the financial industry forum. Blockchain possesses the ability to decentralize databases, and further link separate transaction information through code. This way, it can secure the transactions and offer an extra layer of security to the organizations dealing with sensitive data.

Customer Segmentation: Banks are always under pressure to convert their business models from business-centric to customer-centric models; this means that there is a lot of pressure to understand customer needs and place them before business needs to maximize the efficacy of banking. To facilitate the shift banks need to perform customer segmentation to be able to provide better financial solutions to their customers. Big Data helps perform such tasks with simplicity, thereby enhancing groups and data analysis.

There is no denying the fact that Big Data has increasingly taken over various industries in a short matter of time. The higher the opportunities being exploited, the better the results being displayed by banks and other financial institutions. The idea is to expand efficiency, provide better solutions, and become more customers centric. All the while decreasing the tangent of fraud and risks within the financial domain.

Related Stories
Why is Big Data Analytics Technology so Important

10 Hot Data Analytics Trends — and 5 Going Cold

Big data, machine learning, data science — the data analytics revolution is evolving rapidly. Keep your BA/BI pros and data scientists ahead of the curve with the latest technologies and strategies for data analysis.

Data analytics are fast becoming the lifeblood of IT. Big data, machine learning, deep learning, data science — the range of technologies and techniques for analyzing vast volumes of data is expanding at a rapid pace. To gain deep insights into customer behavior, systems performance, and new revenue opportunities, your data analytics strategy will benefit greatly from being on top of the latest data analytics trends.

Here is a look at the data analytics technologies, techniques and strategies that are heating up and the once-hot data analytics trends that are beginning to cool. From business analysts to data scientists, everyone who works with data is being impacted by the data analytics revolution. If your organization is looking to leverage data analytics for actionable intelligence, the following heat index of data analytics trends should be your guide.
Read more..

Top 7 Technologies to Unleash the Full Potential of Big Data

shutterstock_407505397
When I was wondering “how big is ‘Big Data’?”, I stumbled across an excellent description saying, “A Big Data can be as big as a million of exabytes (1,024 petabytes) or a bazillion of petabytes (1,024 terabytes) containing billions and trillions of records from people worldwide”. And that’s amazing!

Big data is massive and exploding!! Hundreds of companies worldwide are springing up with new projects to extort the full potential of Big Data – that of rapid extraction, loading, transformation, search, analysis and share massive data sets.

Here we go top 7 open source technologies to bring out the best of Big Data that you should start adopting today.

Apache Hive 2.1: If you want your applications to run 100 times faster, Apache is your solution. Apache Hive is Hadoop’s SQL solution. The latest release features performance enhancement keeping Hive as the only solution for SQL on petabytes of data over clusters of thousands of nodes.

Hadoop: One of the most popular MapReduce platforms, Hadoop is a robust enterprise-ready solution to run Big Data servers and applications. For this, you need YARN and HDFS for your primary data store.

Spark: Yet another no—brainer, Spark offers easy-to-use technologies for all Big Data Languages. It is a vast ecosystem that is growing rapidly providing easy batching/micro-batching/SQL support.

Pheonix: An SQL skin on Apache HBase, Pheonix is ideal to support Big Data use cases. It replaces regular HBase client APIs with standard JDBC APIs to insert data, create the table and send queries to HBase Data. It reduces the amount of code, allows transparent performance optimisation to the user, integrates and leverages the power of several other tools.

Zeppelin: It calls itself a web-based notebook empowering interactive data analytics. You can just plug in data/language processing back end into Zeppelin that supports interpreters like Python, Apache Spark, JDBC, Shell and Markdown.

Kafka: Kafka is a fast, durable, scalable and fault-tolerant subscribe and public system. It often replaces message brokers like AMOP and JMS as it features higher throughput, replication and reliability. It is combined with Apache HBase, Apache Storm and Apache Spark for streaming of data and real-time analysis.

NiFi: NiFi maximises the value of data-in-motion. It is designed and built to automate the data flow between systems and create secure data ingestion. Two key roles of NiFi are:
• Accelerate Data Collection and enhances movement for ROI on Big Data
• Collect, secure and transport data from IoT.

Idexcel Big Data Services is focused on dealing effectively with technologies & tools that enable efficient management of Big Data Volume, Diversity and Velocity. With massive and active client engagement spanning several verticals, we help businesses in building data analytics decision within the organisation.

That said, would you like to be another name enlisted on our happy customer directory?

Big Data and Data Visualization

In recent years, there has been a dramatic rise of unstructured data from different sources such as social media, videos and photos, and businesses are looking for relationships between data which can be viewed from multiple perspectives. This evolution of the way the data is being produced, processed and analysed is bringing drastic changes to the world around us.

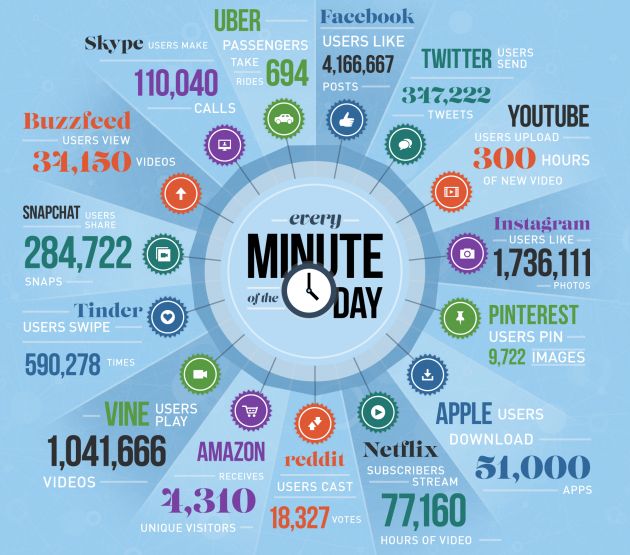
Big data is a term describing large volumes of structured and unstructured data that can be analysed to gain business insights. According to Gartner, big data is a high-volume, high-velocity and high-variety information asset that demands cost-effective innovative forms of information processing for enhanced insight and decision making. In simpler terms, big data is lots of data produced rapidly in many different forms. This rapidly growing data could be related to online videos, customer transactional histories, social media interactions, traffic logs, cell phones, flip computers, tablets, cloud computing, Internet of Things, sensors etc., and global traffic is expected to reach more than 100 trillion gigabytes by 2025. Here is a hint what happens approximately in a minute on the internet, and the generated data continues to grow exponentially:
internet-one-minute-infographic

This huge volume of data needs to be parsed to discover useful threads that can uncover endless opportunities, and can be teamed with innovative ideas to decrease costs, improve overall customer satisfaction, increase revenue, and provide customer tailored offerings. The data requires quick analysis and information must be displayed in a meaningful way. It can be analysed for time reductions, cost reductions, smart decision making, optimizing offerings or new product development.

Big Data focuses on finding hidden trends, threads or patterns that might not be immediately or easily visible. The interpretations bring out insights that would otherwise be impossible to observe using traditional methods. This requires latest technologies and skill set to analyse the flow of information and draw results and conclusions. High powered analytics enable businesses to determine root causes of issues, defects and failures in real time, recalculate complete risk portfolios in just minutes, detect fraud, and so on. NASA, U.S.Government, and organisations like Wal-Mart and Amazon are using Big Data to recognize the possibilities that can help them capitalize the gains.

However, this huge volume of rapidly generating big data cannot be handled using traditional reporting process. To reap maximum benefits, data analytics needs to be done in real time instead of batch processing which fails to capture big data’s immediacy. Another challenge in handling big data is the increased availability of mobile devices. This requires decentralization of reports and adoption of cost-effective, faster and more democratized business intelligence model to improve collaboration and speed insights.

Data Visualization Tools

To make sense of the boring raw data and observe interesting patterns, organisations use visualization tools that help them visualize all their data in minutes. Data Visualization places data in the visual context such as trends, patterns and correlations, which helps organisations understand the significance of the data which may go undetected if this data was just text-based. This beneficial visual matter can help companies eliminate loss making products and increase revenue by minimizing waste. Data visualization can help identify areas that require attention or improvement, help understand product placement, clarify factors influencing customer behaviour and can predict sales volume.

Some of these tools are for developers and require coding, while others contain data visualization software products that do not require coding. Here are some of the commonly used data visualization tools:

1. D3.js (Data Driven Documents) uses CSS, HTML and SVG to render diagrams and charts. The tool is open-source, looks good, is packed with helpful features and is interactivity rich.
2. FusionCharts has an exhaustive collection of maps (965) and charts (90) that work across all platforms and devices, and supports browsers starting from IE6. It supports XML and JSON data formats, and can export charts in JPEG, PNG and PDF. For inspiration, there is a good collection of live demos and business dashboards. Although, the tool is slightly highly priced, it has beautiful interactions and is highly customizable.
3. Chart.js is an open source library that supports bar, line, polar, pie, radar and doughnut chart types. The tool is good for smaller hobby projects.
4. Highcharts offers good range of maps and charts right out of the box. It also offers a different feature rich package called Highstock for stock charts. The tool is free for personal and non-commercial use, and users can export charts in JPG, PNG, PDF and SVG formats.
5. Google Charts can render charts in SVG/HTML5 . It offers cross-browser compatibility and cross-platform portability to Android and iPhones.
6. Datawrapper is commonly used by the non-developers to make interactive charts. The tool is easy to use and can generate effective graphics.
7. Tableau Public is one of the most commonly used visualization tool as it supports variety of maps, graphs, charts and other graphics. The tool is free and can be easily embedded in any webpage.

Raw, Timeline JS, Infogram, plotly, and ChartBlocks are some of the additional data visualization tools. Excel, CVS/JSON, GooGle Chart API, Flot, Raphael, and D3 are some of the entry level tools which are good to quickly explore data or create visualization for internal use.

On the other end of spectrum, there are professional data visualization Pro tools that have expensive subscriptions. There are few free alternatives as well with strong communities and support. Some of these tools include R, Weka, and Gephi.

These data based visualization tools are focussed on the front end of the big data that enable businesses to explore the information and gain deeper understanding by interacting directly with the data. On the other hand, Apache Hadoop is an open source software associated with Big Data to support the back-end concerns such as processing and storage. There are several variants of Hadoop such as MapR, Hortonworks, Cloudera and Amazon. Google BigQuery is a cloud-based service.

Businesses seek most cost-effective ways to increase profitability by managing volume, velocity and variety of the data and turning that data into valuable information to better understand business, customers and marketplace. However, volume, velocity and variety are no longer sufficient to describe the challenges of big data, hence more terms such as variability, veracity, value and visualization have been added that broaden the realm of the big data scope. Big Data is exploding with innovative approach and forward thinking, and organisations can exploit this opportunity to gain market advantage and increase profitability.

Data analytics isn’t about Insights. Idexcel Big Data Roundup

1. How To Use Data To Outsmart Your Competitors

The pressure’s on to use data to outsmart your competitors. Here are six ways companies can use data to imagine and even re-imagine what’s possible.

“Business as usual” can be a risky business practice, especially when there’s cultural resistance to change. While some companies are embracing agile practices, there are a number of data-related barriers that keep companies from reaching their potential, most of which have to do with people, processes, and technology. Read more…

2. Ten Ways Big Data Is Revolutionizing Supply Chain Management

Bottom line: Big data is providing supplier networks with greater data accuracy, clarity, and insights, leading to more contextual intelligence shared across supply chains.

Forward-thinking manufacturers are orchestrating 80% or more of their supplier network activity outside their four walls, using big data and cloud-based technologies to get beyond the constraints of legacy Enterprise Resource Planning (ERP) and Supply Chain Management (SCM) systems. For manufacturers whose business models are based on rapid product lifecycles and speed, legacy ERP systems are a bottleneck. Designed for delivering order, shipment and transactional data, these systems aren’t capable of scaling to meet the challenges supply chains face today. Read more…

3. How Data Projects Drive Revenue Goals

The vast majority of organizations have either already implemented a big data project or plan to do so, according to a recent survey from CA Technologies. The report, titled “The State of Big Data Infrastructure: Benchmarking Global Big Data Users to Drive Future Performance,” indicates that a great deal of these projects are integrated throughout the entire organization. Companies are pursuing big data and analytics primarily to improve the consumer experience while adding to their customer base. However, there are formidable challenges, including a lack of trained staffing to make data projects succeed, as well as the inherent complications of such implementations. Read more…

4. Importance of Big Data Analytics for Business Growth

Until recent years companies have always evaded the question of using data analytics for business execution, leave alone big data. Most of the time it was due to cost of analysis that the organisations kept in mind while keeping away from data analytics. With everything going digital, data is pouring in from all kinds of sources imaginable. Organisations are getting inundated with terabytes and petabytes of data in different formats from sources like operational and transactional systems, customer service points, and mobile and web media. The problem of such huge data is storage and with no proper utilisation of the data, collecting and storing is a waste of resource. Earlier it had been difficult to process such data without relevant technology. Read more…

Big Data: The Engine Driving the Next Era of Computing

You are at a conference. Top business honchos are huddled together with their Excel sheets and paraphernalia. The speaker whips out his palmtop and mutters ‘big data’. There follows an impressive hush. Everyone plays along. You feel emboldened to ask, “Can you define it?” Another hush follows. The big daddys of business are momentarily at a loss. Perhaps they can only Google. You get it? Everyone knows, everyone accepts, big data is big, but no one really knows how, or why. At any rate, no one knows enough straight off the bat.

In the Beginning was Data. Then data defined the world. Now big data is now refining the data-driven world. God is in the last-mile detail. Example: In the number-crunching world of accountancy, intangibles are invading the balance sheet values. “Goodwill” is treated as an expense. It morphs into an asset only when it is acquired externally like say, through a market transaction. Data scientists now ask why can’t we classify Amazon’s vast data pool of its customers as an “asset”? Think of it as the latest straw in the wind of how big data is getting bigger.

Big data is getting bigger and bigger because data today is valued as an economic input as well as an output. The time for austerity is past. Now is the time for audacity. Ask how. Answer: Try crowd sourcing your data defining skills.

When you were not watching, big data was changing the way the technology enablers play the game in the next era of computing. Applications are doing a lot more for a lot less.

Big data isn’t about bits or even gigabytes. It’s about talent. Used wisely, it helps you to take decisions you trust. Naysayers of course see the half-full glass as if it is under threat of an overspill. They insinuate that big data leads to relationships that are unreal. But the reality we don’t know is what is behind all that big data. It is after all, a massy and classy potpourri: part math, part data, with some intuition thrown in. It’s ok if you can’t figure out the math in the big data, because it is all wired in the brain, and certainly not fiction or a fictitious figment of imagination.
When you were not watching, big data was changing the way the technology enablers play the game in the next era of computing. Applications are doing a lot more for a lot less. Just to F5 (we mean refresh…):
You and me can flaunt a dirt cheap $50 computer the size of your palm AND use the same search analysis software that is run by obscenely wealthy Google.

Every physical thing is getting connected, somewhere, at some time or the other, in some or the other ways. AT&T claims a staggering 20,000% growth on wireless traffic over the past 5 years. Cisco expects IP traffic to leap frog ahead and grow four-fold by 2016. And Morgan Stanley breezes through an entire gamut of portfolio analysis, sentiment analysis, predictive analysis, et al for all its large scale investments with the help of Hadoop, the top dog for analyzing complex data. Retail giant Amazon uses one million Hadoop clusters to support their affiliate network, risk management, machine learning, website updates and lots more stuff that works for us.

Data critics though are valiantly trying to hoist big data on its own petard by demanding proof of its efficacy. Proof? Why? Do we really need to prove that we have never ever had a greater, better analyzed, more pervasive, or expansively connected computing power and information at a cheaper price in the history of the world? Give the lovable data devil its due!